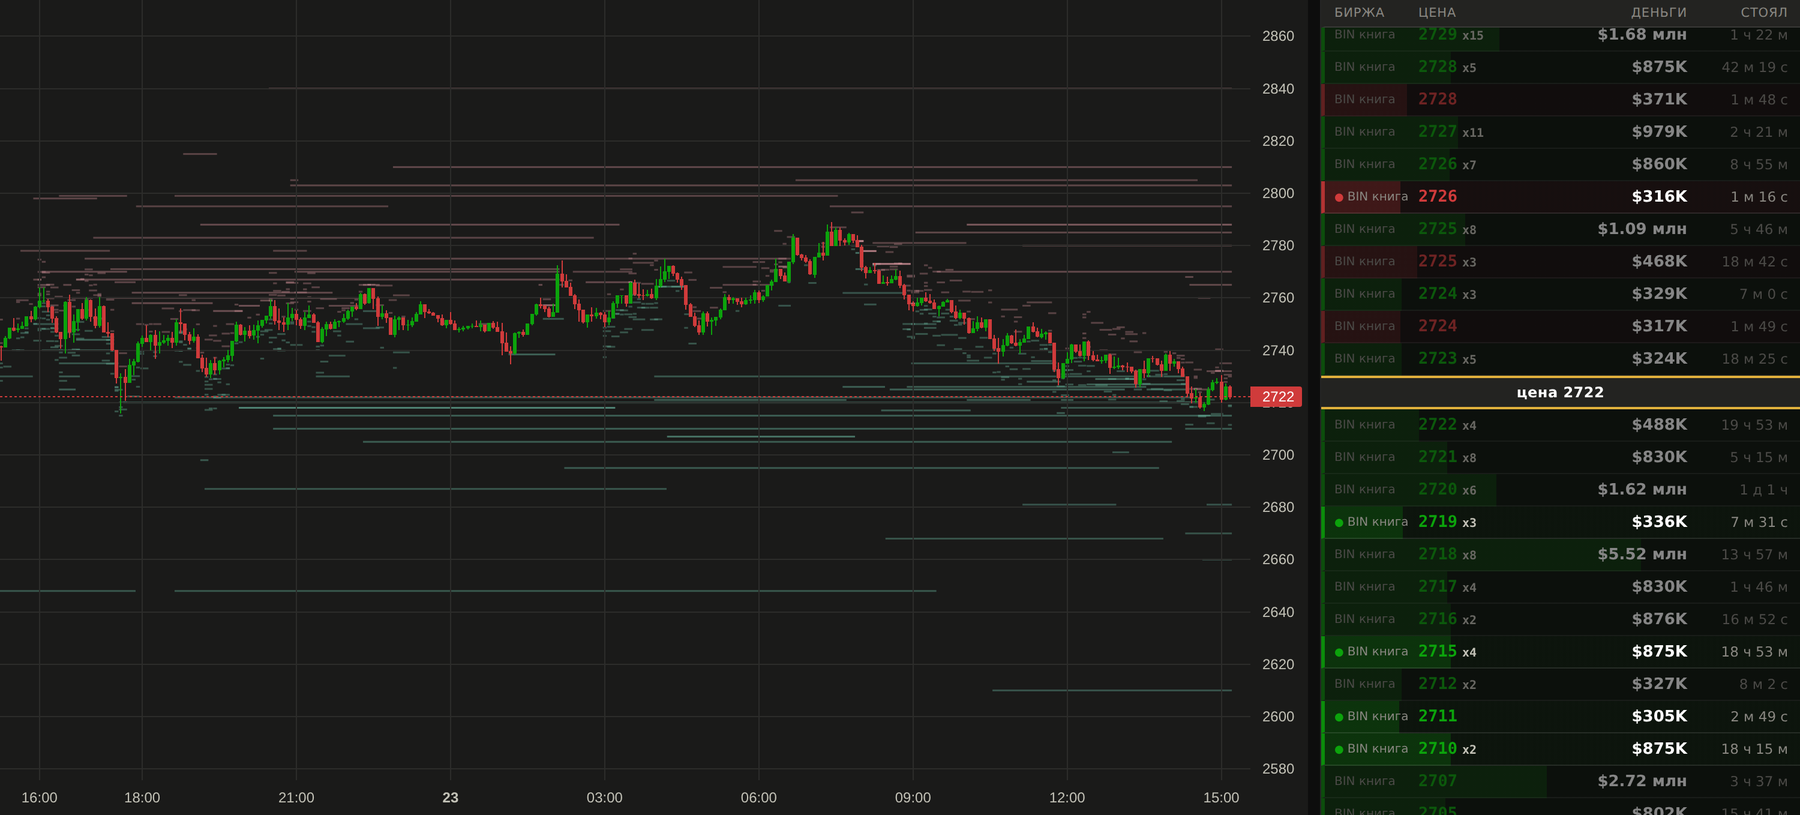
The "Chart" tab: price and the order book heatmap — where the money rests around price and how many times more of it is there than usual. Green is bids, amber is asks.
The order book and large resting orders, volume by price inside every candle, margin borrowing and what is left in the pool, liquidations, funding and open interest — across ~490 Binance coins. Collected by our own collectors, stored on our side, brought together on one screen.
No "buy" and no "sell": the screen shows data and how it was computed.
Join our Telegram channel, choose your language and open your chart.
Open platform
The "Chart" tab: price and the order book heatmap — where the money rests around price and how many times more of it is there than usual. Green is bids, amber is asks.
Charts, order book heatmap, large orders, loans, liquidations and personal alerts. Sign in with Telegram to save your settings.
An ordinary candle answers four questions — open, high, low, close. It does not answer the important one: at which prices inside it the money actually traded. The footprint chart does. Every candle is split into price levels, and each level shows how many dollars went through and which side was the aggressor — a buyer lifting the offer or a seller hitting the bid.
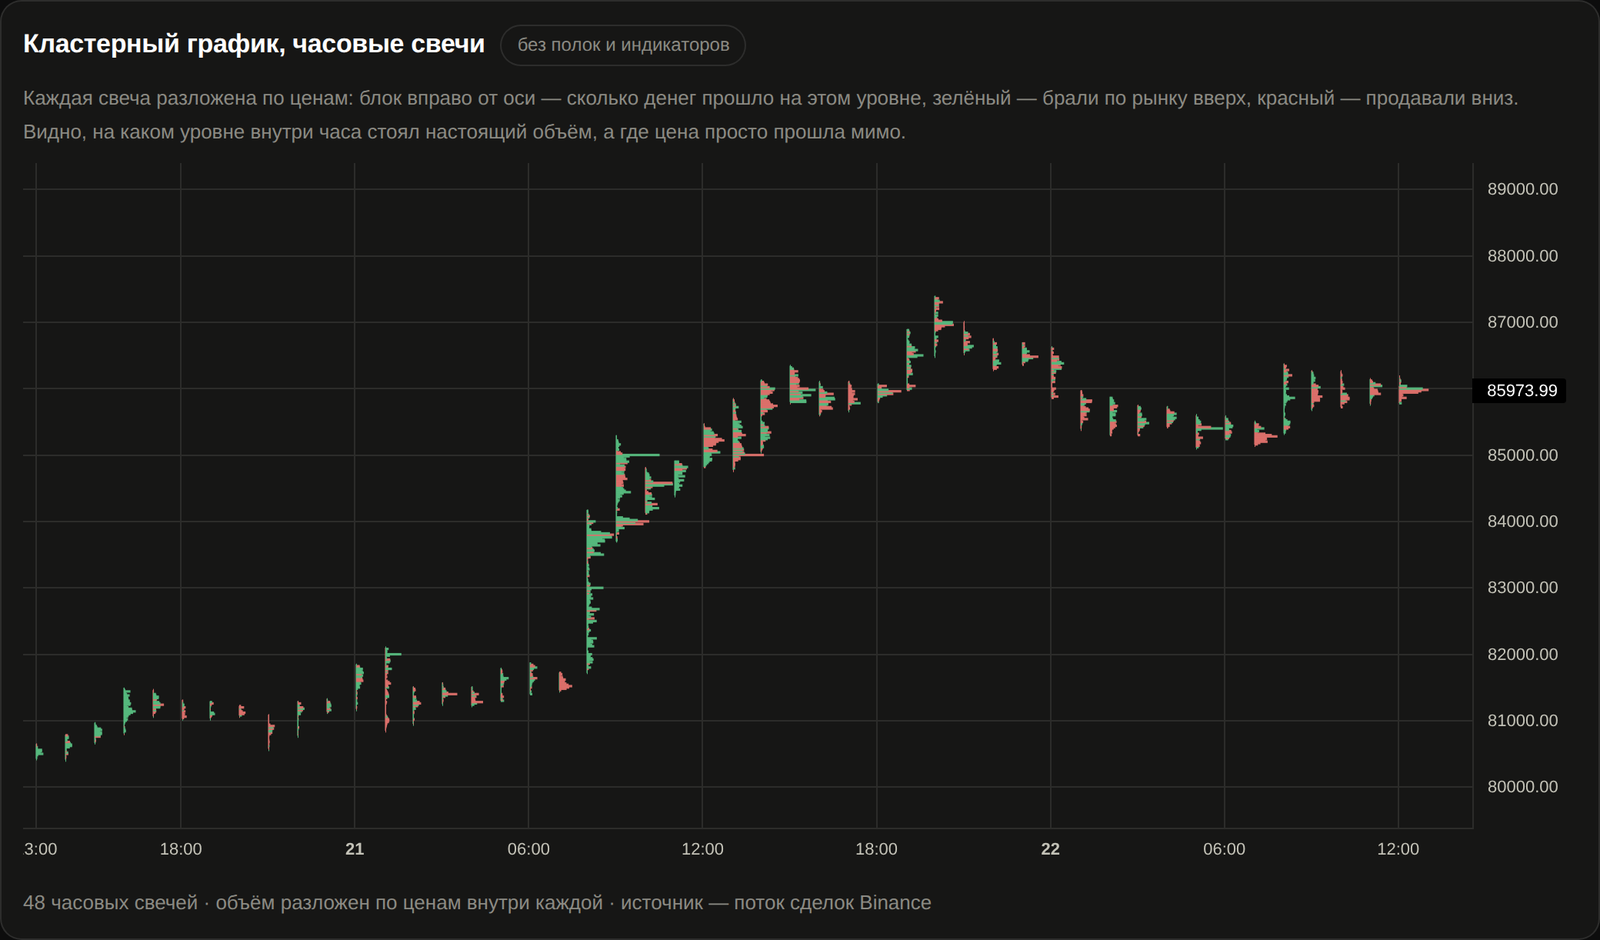
Nothing is smoothed and nothing comes out of a formula. Under every block are real exchange trades, collected by our own stream and stacked into price levels. In dollars, not coins: the same trade measured in coins shrinks by itself as price rises.
A thick block means money traded at that price. A thin line means price was there and volume was not. To an ordinary candle both look the same; here they are two different pictures.
The colour of a block says who was taking: green for market buying, red for market selling. The side comes from the trade stream itself, not guessed from the candle.
A thick block at the top of a candle after which price went no further is obvious at a glance — that is the level where the buyers ran out.
Across ~490 coins, from one minute to one day, over everything we have collected. Available for free after signing in with Telegram.
In the platform you can put large limit orders on top of the footprint: traded volume and resting liquidity in one picture.
And the honest caveat, without which the picture would lie: for coins where our trade stream does not go back to the beginning of the history, older candles are split by a reconstruction from minute bars. The platform says so in the tab header — "real" and "reconstructed" footprints are never passed off as one another.
Thirteen tabs. None of them "predicts": each shows a value you can recompute from exchange data, and says plainly where a value is a model rather than a measurement.
Money resting in the book around price — from 0.15% to 8% away. Brightness is how many times bigger it is than the usual level of that zone over 14 days.
Every candle split into levels: where trading actually happened and which side was the aggressor. Built from the exchange trade stream, not from a textbook formula.
Walls in the book and their life over time: when they appeared, for how much, on which exchange, whether they were filled or pulled. Binance, Coinbase and Hyperliquid together.
How much money sits in the book at every distance from price — from 1.5% to 100% — and how the bid/ask imbalance moved over time.
How much of a coin is borrowed on margin, how much is repaid and what is left in the pool. An empty pool means there is nothing left to borrow — visible in the balance, not in the price.
Real liquidations from the exchange stream plus a map of computed zones: where, by our leverage model, positions at risk have piled up. The model is labelled as a model.
Funding (both settled and live), open interest, long/short ratio, volume and cumulative delta — on the same time grid as price.
Buying effort against the result in price, plus dynamic zones around it: when pressure is high and price does not move, you see it on its own panel.
Nine boards across BTC, ETH and linear USDC contracts: open interest by strike, trades, the volatility index.
A screener over every coin: change and volume over a period, events, favourites — so you can find where to look instead of scrolling 490 charts.
One coin on Binance, Coinbase and Hyperliquid at once: where price and the book have come apart between venues.
A breakdown of major publications: forecast, actual, outcome, Bitcoin's reaction in the first hour measured on our own data, and a plain explanation of the indicator.
The least exciting part of the product and the most important one.
Candles, trades, order book, borrowing, liquidations and futures metrics are collected from the exchanges around the clock and stored on our side. History does not disappear when an exchange stops serving it.
Values are counted in dollars. The same wall measured in coins "shrinks" by itself when price rises — in dollars you can see it never changed.
If a value rests on an assumption, the screen says so. The liquidation zone map is a leverage model, not exchange data; volume inside a candle before the trade stream existed is a reconstruction, and it is marked as one.
Changes are verified with a screenshot of the live page and a measurement against the database — if a fix stops working, the test fails.
We never ask for exchange API keys, never connect to your account and never place trades. Log in with Telegram or email (a code, no password) — we don't ask for anything more.
When data for a period is missing, the platform says so instead of drawing a line through it. An empty area on a map means "not collected here", in plain words.
The platform writes to Telegram when a value crosses the boundary you set, and mirrors the same message to email if one is attached to your account. It is a message about a fact in the data, not advice to buy or sell.
Coin, metric, timeframe, threshold — the form opens pre-filled with whatever you are looking at. Price, volume, order book, borrowing, zones, delta.
A dozen observable situations with strength tiers, so you can keep only the big ones. Each arrives as a card with the numbers and a chart.
Every event says what it was tested on historically and where it fails. If there is no confirmation, that is written down too.
The platform grows out of subscribers' questions, not out of an annual plan. If you need a value we don't have — join the community and tell the admins what you want to see and why. Every member and every opinion matters here: almost everything on the tabs today exists because somebody asked for it.
Telegram channel — market breakdowns and discussion of the platform.
In your own words: what to show, for which coin, based on what. No formulas needed.
If the value can be computed from the data we collect, it shows up in a tab or in the alert builder.
Open the bot and join @btcpumptracker using its button.
Select English or Russian.
Tap “Open platform” to see your chart. All tools are free.
No. We show market data and events in it: how much money rests in the book, where volume traded, how much was borrowed on margin. What to do with that is your decision. We give no trading recommendations, manage no funds and promise no returns.
Yes. All platform features are free after signing in with Telegram.
Straight from the exchanges — Binance, Coinbase, Hyperliquid, Deribit. Collection runs around the clock and the data is stored on our side.
No. We never connect to exchange accounts and never place trades. You log in with Telegram.
Yes, and that is the normal way this platform grows. Write in the community what you want to see — if it can be computed from the data we collect, it will appear.
The platform is available in Russian and English with a language switch. The public pages and the guide exist in both.
All features are free. Sign in with Telegram and open the platform.